Visual PEPR Reports
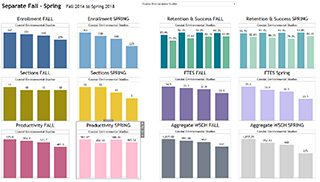
This Tableau of the Program Effectiveness & Planning Report (PEPR) visualization opens in a new window.
Maximize your browser window for easier viewing, Tableau will re-format according to the browser window size.
To zoom in, hit Ctrl and the + (plus) key. To go smaller, use Ctrl and the - (minus) key.
The dropdown for Department remains unchanged across the two tabs. If you change the first
tab to "English" both tabs will use English.
To get a picture/image/PDF of what you see in your browser, click the Download box in the lower right corner.
You have a choice of a PDF (which works very nicely) or image.
To share this link, click the Share symbol in the lower right corner. Cut-and-paste the second Link field.
To revert to a known state, click the Revert icon lower left.
Navigate with the two tabs in the upper left: Separate Fall - Spring and Fall + Spring Over Time
The two tabs display the same information, one is separated into Fall and Spring tables, and the other shows Fall/Spring together over time.
Click the "X" on your browser tab to close and return here.
Data sources used include eLumen, Oxnard Banner and other internal databases. Revised November 5, 2018.
